SOL Price Analysis: Consolidation and Potential Trading Opportunities
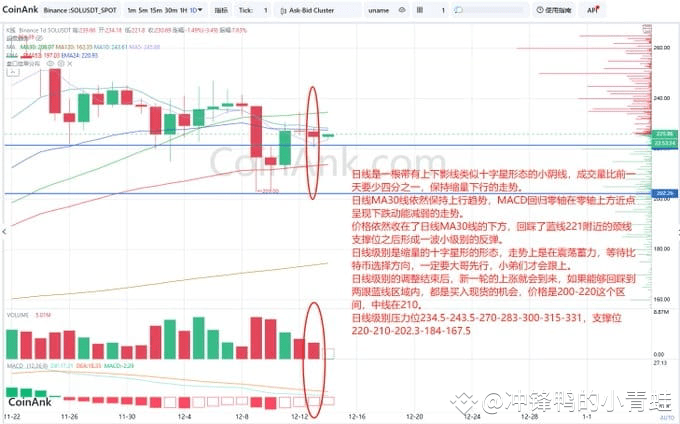
The daily chart for Solana (SOL) reveals a shrinking volume doji candlestick pattern, indicating indecision in the market. Trading volume has decreased by 25% compared to the previous day, and the price remains below the 30-day moving average (MA30). The MACD indicator shows weakening momentum, approaching the zero line. After retracing to the neckline support around $221, the price experienced a minor rebound, resulting in an overall sideways trend. The price action is currently awaiting confirmation of direction from Bitcoin.
Key Support and Resistance Levels:
Daily chart support levels range from (220, )210, (202.3, )184, to (167.5.
Daily chart resistance levels are at )234.5, (243.5, )270, (283, )300, (315, and )331.
A retracement to the (200-)220 range, with a mid-point at $210, presents a potential medium-term buying opportunity.
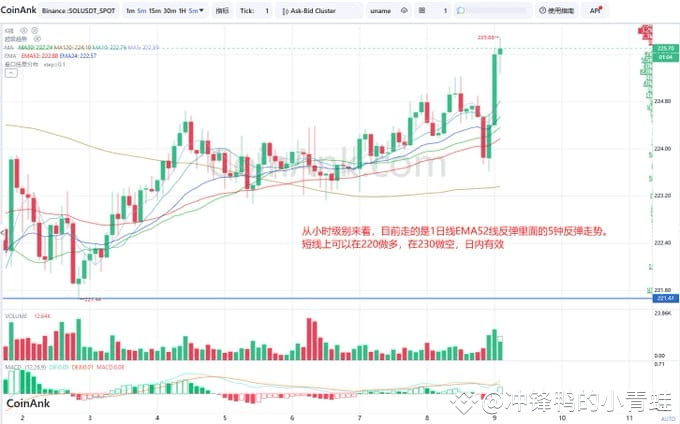
Hourly Chart Analysis:
The hourly chart shows a 5-wave Elliott Wave structure suggesting a bounce within the context of an upward trend against the EMA52.
Short-Term Trading Strategy:
Buy near (220
Sell near )230
These trades are valid for the day.
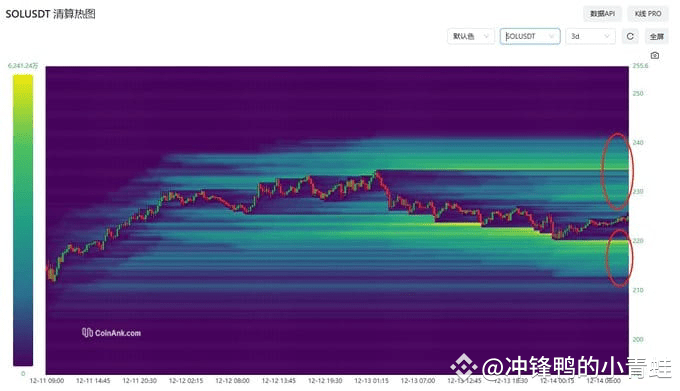
Three-Day Liquidation Heatmap:
A three-day liquidation heatmap reveals significant long liquidations clustered in the (226.2-)240.6 range and short liquidations in the (220.2-)213 range. These areas may act as support and resistance levels based on potential forced liquidations.
Disclaimer: This analysis is for informational purposes only and should not be considered investment advice. The cryptocurrency market is highly volatile, and trading involves significant risk. Conduct thorough research and seek professional financial advice before making any investment decisions.